Introduction:
This week was more of a comparative study between topographic surveying with the distance/azimuth lab two weeks prior (lower grade technology) and the survey grade total station (higher grade technology). The class was broken up into groups of two in order to become familiar with using a total station GPS unit in order to collect various points with attached elevation data near Little Niagara Creek near Phillips Hall (Figure 1). This data would then be used to create a digital elevation model, or DEM, of the study area.
 |
| Figure 1: Study area of topographic survey with Total Staion |
Methods:
Equipment
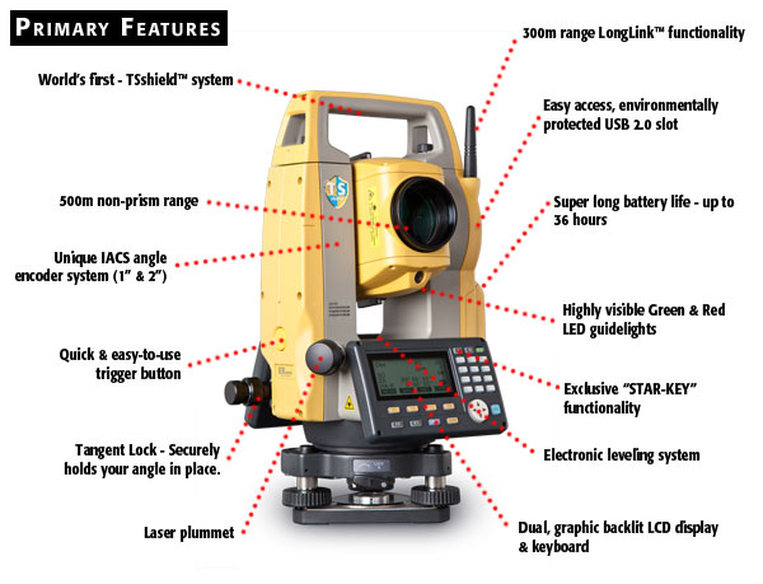 |
| Figure 2: TopCon Total Station |
Procedure
The class was broken down into groups of two with additional help from Dr. Hupy for this activity, with one group of three. The total station is used most effectively and efficiently with the help of three people: one to shoot the Total Station at the Prism, one to hold the Prism over an area to collect a point, and one to collect the points on the Tesla unit.
Prior to the activity, a couple of locations were selected as backsites and were marked with orange flags. The orientation angle is then calculated with the coordinates of the total station and those of the backsites by measuring the angle and the distance between them with the help of the stadia rod.
Next, the total station was leveled on the tripod stand. This was done by swiveling the total station in three directions. When facing a given direction, a circular knob at the base was twisted until the unit was level. So there were three directions and three knobs in total. Only one knob was twisted each time the unit was redirected as to avoid interference with previous levelings.
The Total Station must remain in a single location during the entire survey in order to avoid data discrepancies. This is known as a static or occupied point. 60 points are collected and averaged to provide a highly accurate position of the Total Station. The height of the station and the height of the stadia rod's prism from the ground must be taken and recorded on the GPS before being able to begin. A surveyor can also change the height of the stadia rod's prism in the middle of field work, but the new height must then be recorded. An example of needing to change the prism's height would be when there is a drastic drop in elevation and the prism cannot be seen in the total station. The stadia rod would then be raised so the user at the total station is able to see the prism.
When ready to to record a point, one group member would walk into the area being surveyed with the stadia rod. At each point, the prism on top of the stadia rod must be faced directly towards the total station. Next, the aperture must be leveled by using the plum line on the stadia rod. After those two criteria are met, the group member working the total station must focus the lens over the center of the prism. The top of the total station is on a swivel and can be turned right-left and up-down. It also has a coarse magnifier and fine magnifier in order to focus on the prism. Once the total station has been centered on the prism, the third group member then uses the GPS and records the point. Each group member takes turns on using the Prism, total station, and GPS in order to get a feel of the different parts of the process of collecting topologic points.
 |
| Figure 3: Portion of the normalized notepad text file |
After each group has had a turn in the field, and all of the points had been taken, Dr. Hupy sent the data to the class through notepad (Figure 3). The notepad file could be directly imported into ArcMap where it was then converted into XY data to visualize the points on a map. Kriging, Natural Neighbor, Spline, IDW, and TIN tools were run for all of the points to see which model seemed to represent the data in the most accurate way. The Kriging model seemed to be the best fit (Figure 4).
 |
| Figure 3: Kriging model of topographic points |
Discussion:
This activity showed a rather stark contrast from the distance/azimuth surveying technique. This surveying method is efficient, easy to use, and very accurate. It is a pain, however, that a surveyor is only able to take data of a single point at a time and one must walk to each of those points and level/position the Prism. It would also be a pain to have to pick up and move the Total Station to another area when surveying, I am not sure how common that problem is though. But it was really interesting to learn how to use this instrument.
No comments:
Post a Comment