Friday, May 13, 2016

Activity 11: Navigation with GPS


Introduction:
Figure 1: Study area at the Priory in Eau Claire, WI

This is a follow-up to a previous field activity where the class created navigation maps. The class was split into groups of two where each group member two navigation maps. The best map was then chosen and used for this activity. The best map was chosen by comparing the clutter within the map and observing the coordinate system used. The best map had minimal clutter and had a coordinate system of UTM. The UTM map was used opposed to the decimal degree map because it is far easier and more accurate to navigate using a linear unit such as feet or meters, rather than decimal degrees. The objective of this lab was to navigate through the Priory in Eau Claire, Wisconsin (Figure 1) by using the navigation map and an Etrex GPS unit (Figure 2).
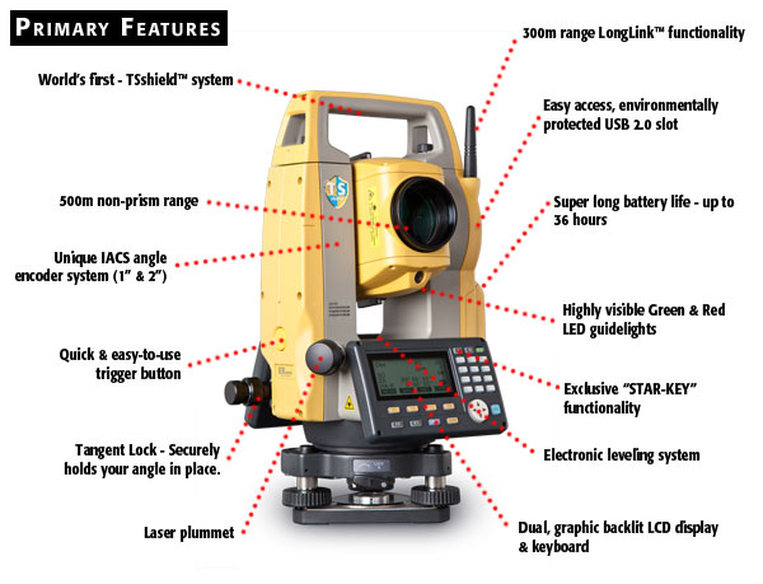
Figure 2: Etrex GPS unit


Methods:
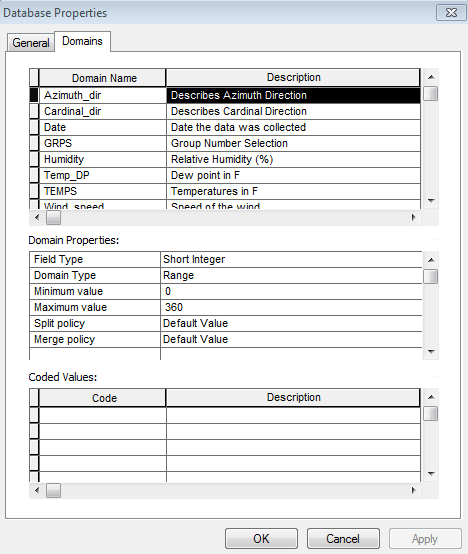
Figure 3: Coordinates of marked locations

Each group had 5 locations that were previously marked with pink ribbons that were labeled with a site number by Dr. Hupy (Figure 3). The GPS unit was used to help navigate through the study area as well as to log our path while navigating and to mark the locations of the course. As Dr. Hupy passed out the paper maps, it was hard not to notice some errors and mistakes on the parts of students. Many of the groups had compared maps and noticed they were in different coordinate systems. The group's map also had the latitude numbers cut off on the side of the map so they had to be filled in with the help of other groups' maps.

Next, the groups had to mark the five locations. This was done by looking at the coordinates given, as shown in figure 2. The points were a bit off on the map from their true location so the GPS unit helped to find the true locations in the field.

The final step was to go out into the field and navigate to the points by using the given coordinate systems, paper map, and GPS unit (Figure 4).
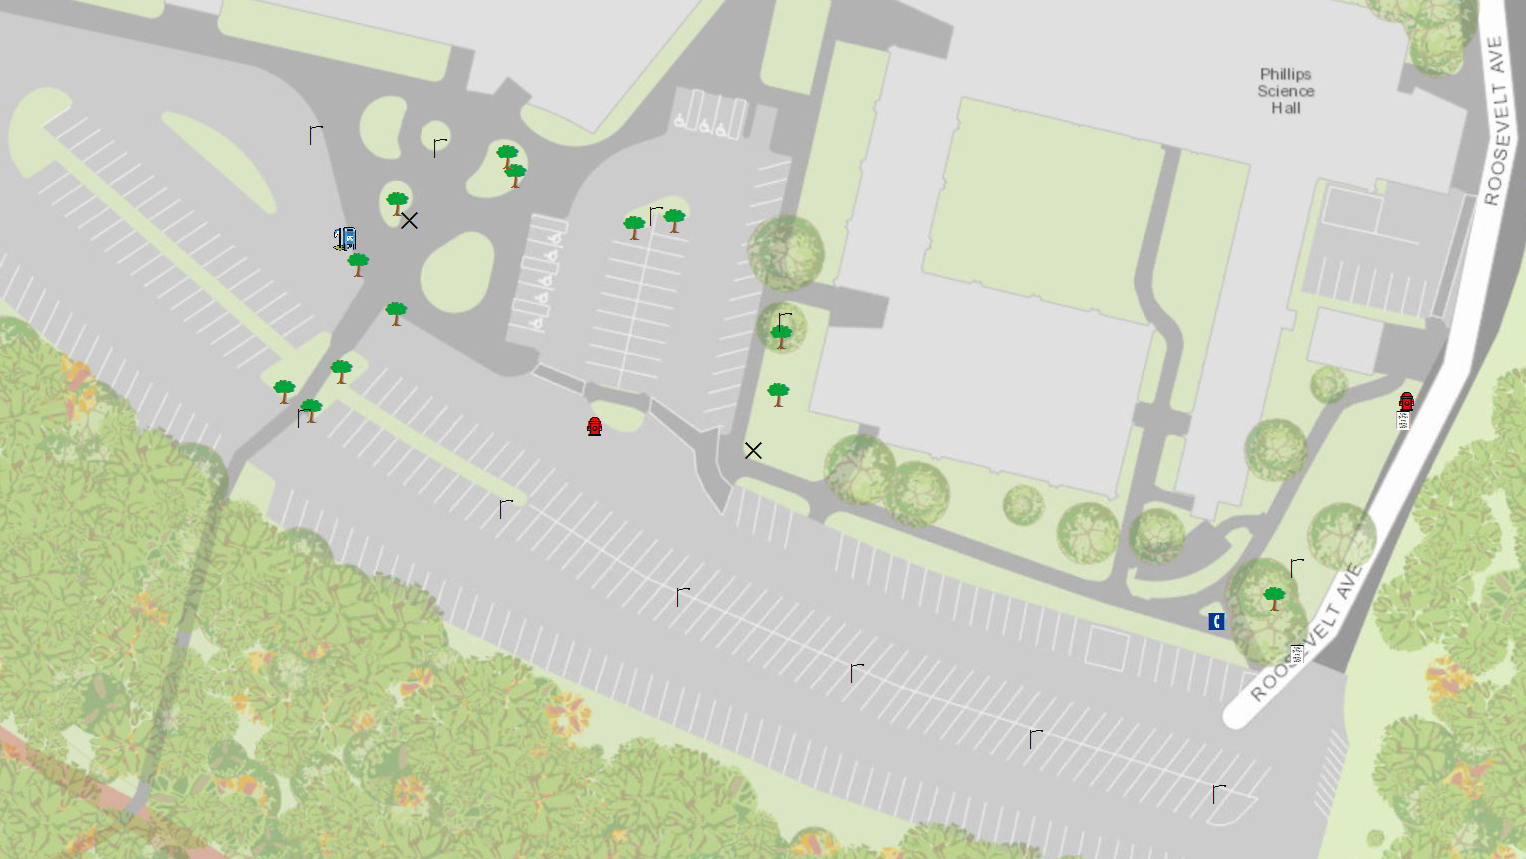
Figure 4: The track log from the GPS unit while navigating the Priory

Discussion:

I noticed it was difficult at times to navigate using the GPS. The group had backtracked a few times because it was hard to get bearings at times. It was difficult to navigate both the northing and easting while walking. The terrain varied greatly, from one area containing thick underbrush, to another area having easily accessible deer paths or a large mowed path, and one area was an open pine tree farm.

Activity 10: Processing UAS Data in Pix4D

Introduction:

This activity is in preparation for an Unmanned Aerial Systems (UAS) lab at the end of the semester. Dr. Hupy gave the class two separate folders (baseball field and track field) containing UAS images within the city of Eau Claire, Wisconsin taken by a previous class. These images would be used in Pix4D to create a georeferenced mosaic of imagery.

Description:


  • What is the overlap needed for Pix4D to process imagery? 
  • What if the user is flying over sand/snow, or uniform fields?
Pix4D is a program that processes images to create a Digital Elevation Model (DEM) as well as a high resolution 3D image of the terrain. It is based on automatically finding thousands of common points between images, and the more common points there are the more accurately the 3D points can be computed. So the main rule to have is to maintain a high overlap between the images. That means at least 75% frontal and 60% side overlap in general cases. There are special precautions to take when taking images of different features. Snow and sand for example have little visual content due to large uniform areas. So it is important to use a high overlap of at leat 85% frontal overlap and at least 70% side overlap. It is also important to set the exposure settings accordingly, to get as much contrast as possible in each image.

  • What is Rapid Check?
There are a couple of templates that can be used. A full processing technique basically provides the best resolution possible, but this takes a significant amount of time so this method is best used when in the office. There is also a rapid check that reduces the resolution of the original images which results in lowered accuracy. This is significantly faster than the full processing, so it is recommended to use while still in the field.

  • Can Pix4D process multiple flights? What does the pilot need to maintain if so?
Yes, it is possible to process each flight separately and then merge the several subprojects. The pilot needs to keep the same horizontal and vertical coordinate system for each flight. The GCPs also have to be in the same horizontal and vertical coordinate systems. And the horizontal and vertical coordinate systems for the output must be the same. It is also important to fly at the same altitude for each flight to keep the resolutions as similar as possible.

  • Can Pix4D process oblique images? What type of data do you need if so?
Yes, Pix4D can process oblique images. The user would need to know at what angle off nadir the images were collected.

  • Are GCPs necessary for Pix4D? When are they highly recommended?
They are not necessary, but they are highly recommended when processing a project with no image geolocation. GCPs give scale, orientation, and absolute position information. 

  • What is the quality report?
It provides all of the metadata behind the processing, such as the amount of overlap between images, the camera used, the coordinate systems,  the image positions, etc. 

Methods:

Figure 2: Selecting  the type of output image
Figure 1: Adding images to Pix4D
Pix4DMapper Pro was opened to a new project where a setup window appeared. Every image in the file folder of the track field were added (Figure 1). The project was saved to a working folder. From there, a 3D model map view was chosen (Figure 2). 


Figure 3: The initial window of the data in mapview
After the parameters were set in the setup menu, a view of the locations where the images were tied down to the earth appeared (Figure 3). From here, the processing tab on the bottom left was clicked where a processing window (Figure 4) appeared. This mosaics the images based on points, vertices, and geotags associated with each image. There are three processes that take place to provide a desired output. The first is an initial processing which is a preliminary step to see if the images are able to provide an accurate output mosaiced image. The next is a point cloud which is a 3D look at an object in an image. The final step is the DSM and Orthomosaic. Each of these outputs was saved to the designated working folder and once the initial processing was finished, a quality report was created to help see how well the images overlap as well as a variety of other important information (See Figures Below).
Figure 4: Processing Window


Quality report images


Sunday, April 24, 2016

Activity 9: Topographic Survey with a Total Station


Introduction:

This week was more of a comparative study between topographic surveying with the distance/azimuth lab two weeks prior (lower grade technology) and the survey grade total station (higher grade technology). The class was broken up into groups of two in order to become familiar with using a total station GPS unit in order to collect various points with attached elevation data near Little Niagara Creek near Phillips Hall (Figure 1). This data would then be used to create a digital elevation model, or DEM, of the study area.
Figure 1: Study area of topographic survey with Total Staion

Methods:

Equipment

Figure 2: TopCon Total Station
The setup included a MiFi portable hotspot and TopCon Tesla on a tripod as well as a TopCon Total Station (Figure 2) which was also situated on a separate tripod stand. There was also a Prism which is held by a user.

Procedure

The class was broken down into groups of two with additional help from Dr. Hupy for this activity, with one group of three. The total station is used most effectively and efficiently with the help of three people: one to shoot the Total Station at the Prism, one to hold the Prism over an area to collect a point, and one to collect the points on the Tesla unit.

Prior to the activity, a couple of locations were selected as backsites and were marked with orange flags. The orientation angle is then calculated with the coordinates of the total station and those of the backsites by measuring the angle and the distance between them with the help of the stadia rod.

Next, the total station was leveled on the tripod stand. This was done by swiveling the total station in three directions. When facing a given direction, a circular knob at the base was twisted until the unit was level. So there were three directions and three knobs in total. Only one knob was twisted each time the unit was redirected as to avoid interference with previous levelings.

The Total Station must remain in a single location during the entire survey in order to avoid data discrepancies. This is known as a static or occupied point. 60 points are collected and averaged to provide a highly accurate position of the Total Station. The height of the station and the height of the stadia rod's prism from the ground must be taken and recorded on the GPS before being able to begin. A surveyor can also change the height of the stadia rod's prism in the middle of field work, but the new height must then be recorded. An example of needing to change the prism's height would be when there is a drastic drop in elevation and the prism cannot be seen in the total station. The stadia rod would then be raised so the user at the total station is able to see the prism.

When ready to to record a point, one group member would walk into the area being surveyed with the stadia rod. At each point, the prism on top of the stadia rod must be faced directly towards the total station. Next, the aperture must be leveled by using the plum line on the stadia rod. After those two criteria are met, the group member working the total station must focus the lens over the center of the prism. The top of the total station is on a swivel and can be turned right-left and up-down. It also has a coarse magnifier and fine magnifier in order to focus on the prism. Once the total station has been centered on the prism, the third group member then uses the GPS and records the point. Each group member takes turns on using the Prism, total station, and GPS in order to get a feel of the different parts of the process of collecting topologic points.
Figure 3: Portion of the normalized notepad text file

After each group has had a turn in the field, and all of the points had been taken, Dr. Hupy sent the data to the class through notepad (Figure 3). The notepad file could be directly imported into ArcMap where it was then converted into XY data to visualize the points on a map. Kriging, Natural Neighbor, Spline, IDW, and TIN tools were run for all of the points to see which model seemed to represent the data in the most accurate way. The Kriging model seemed to be the best fit (Figure 4).

Figure 3: Kriging model of topographic points

Discussion: 

This activity showed a rather stark contrast from the distance/azimuth surveying technique. This surveying method is efficient, easy to use, and very accurate. It is a pain, however, that a surveyor is only able to take data of a single point at a time and one must walk to each of those points and level/position the Prism. It would also be a pain to have to pick up and move the Total Station to another area when surveying, I am not sure how common that problem is though. But it was really interesting to learn how to use this instrument.

Saturday, April 16, 2016

Activity 8: Dual-Frequency GPS Unit

Introduction:

This lab was aimed to familiarize students with surveying various objects using a high precision GPS unit. Topographic surveying can be done in many different ways, as is evident between this surveying technique and the distance/azimuth technique conducted last week. There were seven groups of two students gathering topographic point data for roughly five features per group. I personally surveyed an emergency-call telephone, a tree, a fire hydrant, a light post, and two signs. There was one extra attribute recorded, and that was the diameter of the tree that was surveyed.

Study Area:

  • Date: April 12, 2016
  • Location: University of Wisconsin-Eau Claire behind the Davies and Phillips buildings (Figure 1)
  • Conditions: Cloudy with some wind; temperature of 44 degrees Fahrenheit
Figure 1: Study area using the Dual-Frequency GPS unit


Methods:

Equipment
There were four components used for surveying with the Dual-Frequency GPS unit (Figure 2). The first being the TopCon HiPer S4. This is the GPS receiver that is attached to the top of the unit. Next is the TopCon Tesla which is a screen monitor and creates files and records the data as it is taken. A UTM Zone 15N projected coordinate system was used with the features recorded in the units of meters. A MiFi portable Hotspot ensures a personal wifi hotspot wherever the unit goes. And lastly, a tripod stand kept the unit stable and allowed for the other three components to be attached to a single unit.

The class was broken down into groups of two and each group then took turns collecting point features with the GPS unit. At each location a feature was recorded. The Northing and Easting were recorded with the TopCon HiPer S4, as well as the elevation above sea level. Each time a feature or object was selected to be recorded, that feature must first be selected in a drop-down menu previously created on the GPS unit itself. At each location a feature needed to be recorded, the tripod was simply leveled and positioned as close to the feature as possible to ensure reliable positional data accuracy. Once the user is ready to take the collect the data, the button "collect" is pressed on the TopCon Tesla screen monitor. The TopCon is extremely precise, being able to tie a feature down to just millimeters of the actual location of the unit. The GPS unit collects and averages roughly 20 points after this button is pressed, so it is important not to move the unit during this process. There is also a more accurate method to collecting data, which simply collects a minimum of 60 points when collecting the data. However, for a project like this it is perfectly fine to use the quicker method which does not take quite so many points. This is because the project does not call for highly accurate or precise surveying techniques since it is only used for a teaching tutorial. The Dual-Frequency GPS unit does not need to only be used to gather data for various features. It could also be used to merely take elevation and location data of a sloping study area, for example.

Figure 3: Normalized text file 
Next, the data was exported as a text file into a class folder. The text file had already been normalized so it could be directly transferred to ArcMap. But to normalize a table exported from this GPS unit, the headings would need to be formatted. The final normalized product the class received had the headings: Name, Northing, Easting, Elev, Ellipsoid, Codes, and Shape (Figure 3). The data was then
able to be imported into ArcMap where it was able to be displayed as points by clicking the 'Display XY Data' button. A topographic base map was added to provide a relative backdrop of the locations of the features.

Results:

As a class, there were a total of 33 feature points collected: 14 trees, 11 lamp posts, 2 fire hydrants, 2 campus signs, 2 garbage bins, 1 emergency telephone, and 1 mailbox (Figure 4).
Figure 4: The final map created from the point features data

Discussion:

This method of collecting topographic data with a Dual-Frequency GPS unit seemed to be rather efficient and highly accurate. However, when personally collecting data in the field there were a couple of problems. Right behind the Phillips Science Hall, the GPS unit was not able to gather points effectively. It was a 'dead zone' and the unit was not able to get a fix because there was radio interference which could be caused by electrical wires. This problem can be bypassed simply by changing the setting so the unit does not collect quite as accurate data. And if worse comes to worst, the user can simply turn off the unit and it should be able to get a fix after it is turned back on. It also appeared that the data for tree diameters were not transferred into the table so I wonder why that happened. But it would have been interesting to look at the differences in tree diameters and be able to show that on the map.

Monday, April 11, 2016

Activity 7: Distance/Azimuth Survey

Introduction

This week the focus was turned on to learning how to conduct field work without the reliance on technology. Technology is generally very useful and helps speed up the process of performing field work, but it might not always be reliable or available. So it is important to learn new techniques for data gathering for if and when technology is not practical or when technology fails. Technology could fail due to a number of reasons, such as extreme weather conditions, a device freezing up, running out of batter, etc. Access to a given study area may only be permitted for a short period of time, so it is important to be aware of different survey techniques that could be used if technology were to fail. For this field activity,  two different types of rangefinders were used to map out various trees on campus. The first surveying method required two separate instruments to find the distance and the azimuth such as a rangefinder (figure 1) and a compass (figure 2). The second surveying method utilized an instrument that could measure both the distance and the azimuth (figure 3). 
figure 1: This image shows a Vector Optics laser rangefinder device that was used in the field to collect distance data. This device requires two users where one user holds a device at a desired location and the second user points the unit at the window of the device to determine the horizontal distance between the two devices. 

figure 2: Here is a Suunto compass which was used to find the azimuth by looking through the hole and pointing it at a desired object. 

figure 3: The TruPulse laser shown above was used to collect both the horizontal distance and the azimuth in the field. The user points the unit at a desired object through the eye piece and then fires a laser in order to acquire the corresponding data. This unit is handy because a user is allowed to find both the horizontal distance and the azimuth by using a single device. On top of that, the TruPulse can also be used to determine the height of an object as well as other pertinent information.

Methods

As a class we went near the side of Phillips, an academic building on campus, to conduct the survey using the two methods stated above. A corner of the sidewalk was designated as the point where each of us would stand to collect the distance and azimuth data for the two devices, which was recorded as the x,y location. The class had gathered distance and azimuth data for 17 trees in total along the Little Niagara creek near the side of the building. The tree species and DBH (Diameter at Breast Height) were also recorded. The data for each tree was compiled in a table in each of our notebooks during this field activity, to get accustomed to not using any technology. This data was then transferred into an excel spreadsheet (figure 4).

figure 4: Excel table of data gathered in the field.


Before we could transfer the data into excel, we had to convert our point of origin from degrees, minutes, seconds, into decimal degrees in order to properly and accurately represent the data on ArcMap. In order to do this, we divided the minutes by 60 to give us a precise decimal value. It was important to classify the X, Y and as well as the other fields as "numeric" in excel rather than just "general" so the values could be properly represented in ArcMap.

Once the excel file was imported to ArcMap, a tool "bearing distance to line" was used to display the distance and azimuth data from the table as lines on the map from the point of origin (figure 5).
figure 5: The end result from running the "bearing distance to line" tool on ArcMap.


The next step was to convert the data into points by using the "feature vertices to points" tool. This tool gives the end of the lines an endpoint which helps one to visualize the end of the line on the map (figure 6).
figure 6: The end product from running the "feature vertices to points" tool.


After the endpoints were added, a basemap could be used to show the accuracy of these surveying methods that did not require the use of technology (figure 7).
figure 7: The final result with the use of a basemap to show the accuracy of this method.


Discussion

This lab was very useful because it gave us base knowledge and understanding on ways to conduct field research if our technology were to fail. It was interesting to see how the horizontal distance was consistently different between the two units we had used and to see how accuracy is the limiting factor for the survey. A survey such as the one our class conducted does not need to be very accurate, however. A surveyor needs to mainly gather a liberal amount of data points that provide a general understanding of a study area. For instance, a tree on a survey map does not need to be in the exact location that tree is in the real world. The tree just needs to be in the general vicinity to allow for one to be able to interpret the study area. What is more important are the data and fields collected. The number of bird nests or the species of trees in the general location, for example, are more crucial than the exact location of those features. In order to avoid as discrepancies though, it is important for a user or multiple users to follow the same data collection techniques. It would not be in one's best interest if one user who is tall in stature were to hold a rangefinder right next to their chest and another shorter user were to hold a rangefinder lower to the ground and away from their chest. It is important to have uniform collection techniques in order to avoid as many discrepancies in the data as possible. Because the weather was not ideal, it is also important to take into consideration the way a user takes field notes. The use of a pencil is crucial to use in rainy or wet conditions. Pens tend to bleed and run when exposed to water. A small field notebook with waterproof paper would also be useful to have. To be aware of and make simple changes like those could save a lot of time and headache while working in the field. So as always, it is important to be well prepared for a task at hand before going out into the field. As a class we had mixed up our X and Y data so the data was not properly represented in ArcMap at first. So in order to continue, I needed to switch the X and Y values accordingly and also needed to add a negative sign to the X values based on the the longitude of Eau Claire.

Conclusion

This lab was very informative and helpful. Being able to use this new method of locating and plotting points will be extremely beneficial in the future when technology will let me down. I looked online at the rangefinders and noticed that they were quite expensive. So this method could also be applied to the use of a measuring tape and compass to find distance and azimuth of features. Being able to use TruPulse, Vector Optics, and Suunto are more tools I am now familiar with and the continued use of Excel and ArcMap are greatly helping me understand and be familiar with the two platforms.


Saturday, March 19, 2016

Parcel Mapping Forum

I first attended the session from 12:45 to 1:45pm where I first learned about the work Jason Poser and Frank Conkling did on ‘Transforming a County Land Information Program – Starting with the Parcel Fabric’ for Buffalo County. I have heard of parcel mapping before but I never knew quite what it meant so it was nice to hear about a real world project involving parcel mapping. The two men had originally used CAD for parcel mapping and they worked with employees that were not well trained and they did not receive enough funding, both of which made their job very difficult to do mapping. They realized that they could not continue to use CAD and if they were to continue using CAD, they would continue to run into a large number of problems. So then they decided to switch over to parcel fabric. They were able to map parcels in parcel fabric without the need of a PLSS, which could allow for easy property changes. Over the course of eight years using CAD they were only able to map about 40% of the county but by using parcel fabric for just a few months, they mapped roughly 30%. Parcel fabric allows one to create a polygon and to keep the metadata associated with that parcel, then once can accurately move that parcel to an accurate location at the end, which was interesting to learn. Using parcel fabric for this project is a pretty manual process with unjoining and moving parcels without much math involved (i.e. RMSE), and they have an open data policy!!

I then learned about a project that involved mapping or monumenting corners. They have their corners monumented with the help of tie sheets for Barron County and are in the process of restoring all of the corners of Barron County. I didn’t quite learn what corners are used for or how they are important, but it did seem rather interesting and a really tedious process. The speaker talked about how many of the people he works with have been there for a while and that there are very few turnovers, which would be nice because everybody would be well educated and I bet there would be some nice chemistry in place to help complete tasks more easily. It was interesting to see that many monuments have been trees in the past and have been replaced by ‘markers’ through the years. Many of these markers have been buried under roads which I never would have guessed. He made it a point to build and keep good relations with law officers and the community, because they can either help with the project or cause a lot of pain and headache if you do not have a good relationship with them. It is also important to keep your firmware up to date which makes sense, but I probably would not have thought about that on my own. And he also made it a point to note that redundancy is important!!!
Next, Brett Budrow talked about the PLSS and Parcels of St. Croix County. He used a multi-purpose cadastic with the help of PLSS and other means, which helped to map the parcels. He mentioned that they used a bounty system, which I have never heard about until that presentation. It was interesting to learn that the original survey was in 1847-1849 and they still go back to those surveys and have built upon those surveys over the years, but the first full-time surveyor was only hired in 1989. Again, he used tie sheets for monumentation just like the first speakers and they tied PLSS with parcel mapping in the late 90’s. He had to work with surveys that lacked geodetic control so his first step was to geodetically ‘fix’ the section and quarter-quarter section corners. The department had a parcel conversion project in 2001 and continual maintenance/spatial improvement is needed for the tax parcels, so funding is very important for a project like this.


The last section of the forum involved a discussion about various aspects of parcel mapping. It was interesting to hear that the different groups have similar ideas but the way they presented those ideas had quite different implications behind them. Some of the important highlights I gleaned from the discussion included the fact that everyone should be on the same level of accuracy. The county level is the best place to determine needs for the county, which is a simple and common sense approach but it is invaluable to do. Parcels should be mapped according to their value, meaning that prioritization of parcels is key. Communication is very important to determine the user’s needs, educate the public about parcel mapping and the importance behind it, strengthen collaboration between parcel mapping professionals as well as collaboration between the professionals and the public, etc. Parcel mapping is always a work in progress and one needs to provide a product for the user but at the same time continue towards an ultimate end game. It is important to aim for perfect and complete, but to accept incremental improvements and local prioritization matters. It is crucial to mandate parcel mapping and mutual respect between WLIP and PLSS is beneficial. It is good to have a professional surveyor. Funding is very limited so educating the public as well as elected officials is very important in order to convince people to invest money into these efforts. PLSS is the foundation of determining property taxes. At the end of the discussion we were asked to answer a question. What is the most important step we can take to improve parcel mapping? There were quite a few different answers and I enjoyed hearing other people’s thoughts on the matter. I personally thought the most important step is to educate the public and government on this application and its importance. This in turn will help the projects receive more funding as well as to help facilitate collaboration and ultimately ease the process of parcel mapping and create a better product in the end.

Monday, February 29, 2016

Activity 4: Geodatabases, Attributes, and Domains

Introduction

In this week's assignment, I was to create a geodatabase that would in turn be deployed in ArcPad. This geodatabase will be used to create a microclimate map which then will be a part of an activity down the road. The geodatabase needs to contain various data for each point taken in the field. These data attributes include: temperature, dew point, wind speed, wind direction (cardinal and azimuth), group number, relative humidity, and the most important being an attribute for note taking. It is important to create a good geodatabase with valuable domains before heading out into the field. Having domains allows for easier and quicker data collection as well as reduces the potential of incorrectly inputting values for different attributes. This activity also helped to be able use ArcPad to collect different data for the micro climate around campus and to import that data into ArcMap. It is important to properly create a geodatabase because an activity such as collecting micro climate data is supposed to take as little time as possible as to avoid discrepancies in the data due to temporal variances. It is also important to practice good normalization as to avoid problems and headaches when manipulating data back in the lab.

Part 1

The first step is to get ready to create a micro climate geodatabase. In order to do so, one needs to plan ahead and figure out the attributes that are required or important before heading into the field. It is crucial to have the proper tools and a Trimble Juno GPS unit (figure 1) is one of the most important tools to have for a project such as this. This allows for a geodatabase to be uploaded to the mobile device and allows for data to be collected and surveyed on the fly in a more or less mobile version of ArcMap. As mentioned before, it is important to plan ahead and figure out the different attributes that are important to collect to get a nice understanding of different microclimates. For this activity, it is important to understand what a microclimate is. A microclimate is a small restricted area that varies in temperature, humidity, wind speed, etc. (climate) of another climate or area nearby.


figure 1: The Trimble Juno GPS unit that will be used for data collection later on. 

Part 2

Step 1 - Construction of a Geodatabase

This is probably one of the fastest steps of the whole process. I first had to go into ArcCatalog and create a new file geodatabase in a folder I created. Now my geodatabase was created (figure 2).

figure 2: The new geodatabase named 'mc_hagenjc.gdb' that will be used to collect and analyze the data from this project

Steps 2 & 3 - Development of Geodatabase Domains/Development of Domain Ranges

This step is very important because it helps save time and reduces the chances of making user errors when inputting values, as mentioned before. By looking at the data that will be collected, one can determine what the domains (a set of rules assigned to a given attribute) and ranges will be set as (figure 3). For example, temperature was given a range of 15-60 degrees Fahrenheit so values that lie out of this range will not be recorded. Coded values were also used for wind direction, so recording an N would imply that the wind direction was north, and SW would imply southwest. It is good to observe the attributes you decide to collect as well as when and where they are collected. It would be cumbersome and possibly problematic to set a range of -50 to 150 for temperature in spring because temperature will most likely not reach a value near -50 or 150. That is why I chose to use a range of 15-60 for the time of year I would be collecting data. When creating domains, it is important to create a description in order to know exactly what the domain is, especially if you decide to abbreviate domain names. On top of that, the knowledge of data type must be understood. For instance, what implications short integer, long integer, float, and text have on the data being collected.

figure 3: Example of a domain name, description, field and domain type, and domain range
Step 4 - Construction of a Feature Class for Later Deployment in ArcPad

After the domains have been created, it is time to create a feature class. A feature class is collection of features that all have the same spatial representation such as a point, line, or polygon and a common set of attribute columns. For this activity, a point feature class was created with a UTM zone 15 projection. It is important to note that only one feature class should be created, otherwise you would have to filter through numerous feature classes in the field for each attribute.

Step 5

I decided to add another step by importing an aerial basemap of the study area. The basemap should be zoomed in to the desired area to avoid pixilating the image as well as to prevent the Trimble from taking a long time to buffer the image. I figured having a basemap would help for easier navigation around the campus and to make sure I was in an accurate location on the map as compared to the field.

Discussion

It can be easy to create a geodatabase if you know what you are doing. But it appears you can potentially run into a plethora of problems such as using a short integer when a long integer is required, or not properly setting a domain range. These types of errors can easily be avoided by planning ahead for the project and determining best practices ahead of time. On top of that, human errors can also occur in the field so that is one importance of setting domains to combat those user errors. It is hard to keep in mind to use best practices to make data interpretation not only easy for yourself, but also for other people who could potentially use the data you have collected. So I have been trying to keep in mind to write out detailed descriptions and try to make sure that another person could understand my data and use it without running into problems that could have easily been avoided if I were more careful and conscientious in pre-planning.