Sunday, April 24, 2016

Activity 9: Topographic Survey with a Total Station


Introduction:

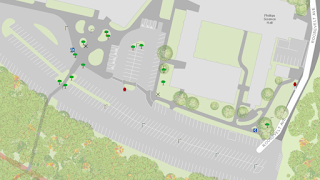
This week was more of a comparative study between topographic surveying with the distance/azimuth lab two weeks prior (lower grade technology) and the survey grade total station (higher grade technology). The class was broken up into groups of two in order to become familiar with using a total station GPS unit in order to collect various points with attached elevation data near Little Niagara Creek near Phillips Hall (Figure 1). This data would then be used to create a digital elevation model, or DEM, of the study area.
Figure 1: Study area of topographic survey with Total Staion

Methods:

Equipment

Figure 2: TopCon Total Station
The setup included a MiFi portable hotspot and TopCon Tesla on a tripod as well as a TopCon Total Station (Figure 2) which was also situated on a separate tripod stand. There was also a Prism which is held by a user.

Procedure

The class was broken down into groups of two with additional help from Dr. Hupy for this activity, with one group of three. The total station is used most effectively and efficiently with the help of three people: one to shoot the Total Station at the Prism, one to hold the Prism over an area to collect a point, and one to collect the points on the Tesla unit.

Prior to the activity, a couple of locations were selected as backsites and were marked with orange flags. The orientation angle is then calculated with the coordinates of the total station and those of the backsites by measuring the angle and the distance between them with the help of the stadia rod.

Next, the total station was leveled on the tripod stand. This was done by swiveling the total station in three directions. When facing a given direction, a circular knob at the base was twisted until the unit was level. So there were three directions and three knobs in total. Only one knob was twisted each time the unit was redirected as to avoid interference with previous levelings.

The Total Station must remain in a single location during the entire survey in order to avoid data discrepancies. This is known as a static or occupied point. 60 points are collected and averaged to provide a highly accurate position of the Total Station. The height of the station and the height of the stadia rod's prism from the ground must be taken and recorded on the GPS before being able to begin. A surveyor can also change the height of the stadia rod's prism in the middle of field work, but the new height must then be recorded. An example of needing to change the prism's height would be when there is a drastic drop in elevation and the prism cannot be seen in the total station. The stadia rod would then be raised so the user at the total station is able to see the prism.

When ready to to record a point, one group member would walk into the area being surveyed with the stadia rod. At each point, the prism on top of the stadia rod must be faced directly towards the total station. Next, the aperture must be leveled by using the plum line on the stadia rod. After those two criteria are met, the group member working the total station must focus the lens over the center of the prism. The top of the total station is on a swivel and can be turned right-left and up-down. It also has a coarse magnifier and fine magnifier in order to focus on the prism. Once the total station has been centered on the prism, the third group member then uses the GPS and records the point. Each group member takes turns on using the Prism, total station, and GPS in order to get a feel of the different parts of the process of collecting topologic points.
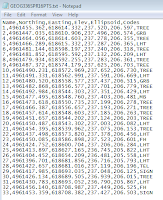
Figure 3: Portion of the normalized notepad text file

After each group has had a turn in the field, and all of the points had been taken, Dr. Hupy sent the data to the class through notepad (Figure 3). The notepad file could be directly imported into ArcMap where it was then converted into XY data to visualize the points on a map. Kriging, Natural Neighbor, Spline, IDW, and TIN tools were run for all of the points to see which model seemed to represent the data in the most accurate way. The Kriging model seemed to be the best fit (Figure 4).

Figure 3: Kriging model of topographic points

Discussion: 

This activity showed a rather stark contrast from the distance/azimuth surveying technique. This surveying method is efficient, easy to use, and very accurate. It is a pain, however, that a surveyor is only able to take data of a single point at a time and one must walk to each of those points and level/position the Prism. It would also be a pain to have to pick up and move the Total Station to another area when surveying, I am not sure how common that problem is though. But it was really interesting to learn how to use this instrument.

Saturday, April 16, 2016

Activity 8: Dual-Frequency GPS Unit

Introduction:

This lab was aimed to familiarize students with surveying various objects using a high precision GPS unit. Topographic surveying can be done in many different ways, as is evident between this surveying technique and the distance/azimuth technique conducted last week. There were seven groups of two students gathering topographic point data for roughly five features per group. I personally surveyed an emergency-call telephone, a tree, a fire hydrant, a light post, and two signs. There was one extra attribute recorded, and that was the diameter of the tree that was surveyed.

Study Area:

  • Date: April 12, 2016
  • Location: University of Wisconsin-Eau Claire behind the Davies and Phillips buildings (Figure 1)
  • Conditions: Cloudy with some wind; temperature of 44 degrees Fahrenheit
Figure 1: Study area using the Dual-Frequency GPS unit


Methods:

Equipment
There were four components used for surveying with the Dual-Frequency GPS unit (Figure 2). The first being the TopCon HiPer S4. This is the GPS receiver that is attached to the top of the unit. Next is the TopCon Tesla which is a screen monitor and creates files and records the data as it is taken. A UTM Zone 15N projected coordinate system was used with the features recorded in the units of meters. A MiFi portable Hotspot ensures a personal wifi hotspot wherever the unit goes. And lastly, a tripod stand kept the unit stable and allowed for the other three components to be attached to a single unit.

The class was broken down into groups of two and each group then took turns collecting point features with the GPS unit. At each location a feature was recorded. The Northing and Easting were recorded with the TopCon HiPer S4, as well as the elevation above sea level. Each time a feature or object was selected to be recorded, that feature must first be selected in a drop-down menu previously created on the GPS unit itself. At each location a feature needed to be recorded, the tripod was simply leveled and positioned as close to the feature as possible to ensure reliable positional data accuracy. Once the user is ready to take the collect the data, the button "collect" is pressed on the TopCon Tesla screen monitor. The TopCon is extremely precise, being able to tie a feature down to just millimeters of the actual location of the unit. The GPS unit collects and averages roughly 20 points after this button is pressed, so it is important not to move the unit during this process. There is also a more accurate method to collecting data, which simply collects a minimum of 60 points when collecting the data. However, for a project like this it is perfectly fine to use the quicker method which does not take quite so many points. This is because the project does not call for highly accurate or precise surveying techniques since it is only used for a teaching tutorial. The Dual-Frequency GPS unit does not need to only be used to gather data for various features. It could also be used to merely take elevation and location data of a sloping study area, for example.

Figure 3: Normalized text file 
Next, the data was exported as a text file into a class folder. The text file had already been normalized so it could be directly transferred to ArcMap. But to normalize a table exported from this GPS unit, the headings would need to be formatted. The final normalized product the class received had the headings: Name, Northing, Easting, Elev, Ellipsoid, Codes, and Shape (Figure 3). The data was then
able to be imported into ArcMap where it was able to be displayed as points by clicking the 'Display XY Data' button. A topographic base map was added to provide a relative backdrop of the locations of the features.

Results:

As a class, there were a total of 33 feature points collected: 14 trees, 11 lamp posts, 2 fire hydrants, 2 campus signs, 2 garbage bins, 1 emergency telephone, and 1 mailbox (Figure 4).
Figure 4: The final map created from the point features data

Discussion:

This method of collecting topographic data with a Dual-Frequency GPS unit seemed to be rather efficient and highly accurate. However, when personally collecting data in the field there were a couple of problems. Right behind the Phillips Science Hall, the GPS unit was not able to gather points effectively. It was a 'dead zone' and the unit was not able to get a fix because there was radio interference which could be caused by electrical wires. This problem can be bypassed simply by changing the setting so the unit does not collect quite as accurate data. And if worse comes to worst, the user can simply turn off the unit and it should be able to get a fix after it is turned back on. It also appeared that the data for tree diameters were not transferred into the table so I wonder why that happened. But it would have been interesting to look at the differences in tree diameters and be able to show that on the map.

Monday, April 11, 2016

Activity 7: Distance/Azimuth Survey

Introduction

This week the focus was turned on to learning how to conduct field work without the reliance on technology. Technology is generally very useful and helps speed up the process of performing field work, but it might not always be reliable or available. So it is important to learn new techniques for data gathering for if and when technology is not practical or when technology fails. Technology could fail due to a number of reasons, such as extreme weather conditions, a device freezing up, running out of batter, etc. Access to a given study area may only be permitted for a short period of time, so it is important to be aware of different survey techniques that could be used if technology were to fail. For this field activity,  two different types of rangefinders were used to map out various trees on campus. The first surveying method required two separate instruments to find the distance and the azimuth such as a rangefinder (figure 1) and a compass (figure 2). The second surveying method utilized an instrument that could measure both the distance and the azimuth (figure 3). 
figure 1: This image shows a Vector Optics laser rangefinder device that was used in the field to collect distance data. This device requires two users where one user holds a device at a desired location and the second user points the unit at the window of the device to determine the horizontal distance between the two devices. 

figure 2: Here is a Suunto compass which was used to find the azimuth by looking through the hole and pointing it at a desired object. 

figure 3: The TruPulse laser shown above was used to collect both the horizontal distance and the azimuth in the field. The user points the unit at a desired object through the eye piece and then fires a laser in order to acquire the corresponding data. This unit is handy because a user is allowed to find both the horizontal distance and the azimuth by using a single device. On top of that, the TruPulse can also be used to determine the height of an object as well as other pertinent information.

Methods

As a class we went near the side of Phillips, an academic building on campus, to conduct the survey using the two methods stated above. A corner of the sidewalk was designated as the point where each of us would stand to collect the distance and azimuth data for the two devices, which was recorded as the x,y location. The class had gathered distance and azimuth data for 17 trees in total along the Little Niagara creek near the side of the building. The tree species and DBH (Diameter at Breast Height) were also recorded. The data for each tree was compiled in a table in each of our notebooks during this field activity, to get accustomed to not using any technology. This data was then transferred into an excel spreadsheet (figure 4).

figure 4: Excel table of data gathered in the field.


Before we could transfer the data into excel, we had to convert our point of origin from degrees, minutes, seconds, into decimal degrees in order to properly and accurately represent the data on ArcMap. In order to do this, we divided the minutes by 60 to give us a precise decimal value. It was important to classify the X, Y and as well as the other fields as "numeric" in excel rather than just "general" so the values could be properly represented in ArcMap.

Once the excel file was imported to ArcMap, a tool "bearing distance to line" was used to display the distance and azimuth data from the table as lines on the map from the point of origin (figure 5).
figure 5: The end result from running the "bearing distance to line" tool on ArcMap.


The next step was to convert the data into points by using the "feature vertices to points" tool. This tool gives the end of the lines an endpoint which helps one to visualize the end of the line on the map (figure 6).
figure 6: The end product from running the "feature vertices to points" tool.


After the endpoints were added, a basemap could be used to show the accuracy of these surveying methods that did not require the use of technology (figure 7).
figure 7: The final result with the use of a basemap to show the accuracy of this method.


Discussion

This lab was very useful because it gave us base knowledge and understanding on ways to conduct field research if our technology were to fail. It was interesting to see how the horizontal distance was consistently different between the two units we had used and to see how accuracy is the limiting factor for the survey. A survey such as the one our class conducted does not need to be very accurate, however. A surveyor needs to mainly gather a liberal amount of data points that provide a general understanding of a study area. For instance, a tree on a survey map does not need to be in the exact location that tree is in the real world. The tree just needs to be in the general vicinity to allow for one to be able to interpret the study area. What is more important are the data and fields collected. The number of bird nests or the species of trees in the general location, for example, are more crucial than the exact location of those features. In order to avoid as discrepancies though, it is important for a user or multiple users to follow the same data collection techniques. It would not be in one's best interest if one user who is tall in stature were to hold a rangefinder right next to their chest and another shorter user were to hold a rangefinder lower to the ground and away from their chest. It is important to have uniform collection techniques in order to avoid as many discrepancies in the data as possible. Because the weather was not ideal, it is also important to take into consideration the way a user takes field notes. The use of a pencil is crucial to use in rainy or wet conditions. Pens tend to bleed and run when exposed to water. A small field notebook with waterproof paper would also be useful to have. To be aware of and make simple changes like those could save a lot of time and headache while working in the field. So as always, it is important to be well prepared for a task at hand before going out into the field. As a class we had mixed up our X and Y data so the data was not properly represented in ArcMap at first. So in order to continue, I needed to switch the X and Y values accordingly and also needed to add a negative sign to the X values based on the the longitude of Eau Claire.

Conclusion

This lab was very informative and helpful. Being able to use this new method of locating and plotting points will be extremely beneficial in the future when technology will let me down. I looked online at the rangefinders and noticed that they were quite expensive. So this method could also be applied to the use of a measuring tape and compass to find distance and azimuth of features. Being able to use TruPulse, Vector Optics, and Suunto are more tools I am now familiar with and the continued use of Excel and ArcMap are greatly helping me understand and be familiar with the two platforms.