Friday, May 13, 2016

Activity 11: Navigation with GPS


Introduction:
Figure 1: Study area at the Priory in Eau Claire, WI

This is a follow-up to a previous field activity where the class created navigation maps. The class was split into groups of two where each group member two navigation maps. The best map was then chosen and used for this activity. The best map was chosen by comparing the clutter within the map and observing the coordinate system used. The best map had minimal clutter and had a coordinate system of UTM. The UTM map was used opposed to the decimal degree map because it is far easier and more accurate to navigate using a linear unit such as feet or meters, rather than decimal degrees. The objective of this lab was to navigate through the Priory in Eau Claire, Wisconsin (Figure 1) by using the navigation map and an Etrex GPS unit (Figure 2).
Figure 2: Etrex GPS unit


Methods:
Figure 3: Coordinates of marked locations

Each group had 5 locations that were previously marked with pink ribbons that were labeled with a site number by Dr. Hupy (Figure 3). The GPS unit was used to help navigate through the study area as well as to log our path while navigating and to mark the locations of the course. As Dr. Hupy passed out the paper maps, it was hard not to notice some errors and mistakes on the parts of students. Many of the groups had compared maps and noticed they were in different coordinate systems. The group's map also had the latitude numbers cut off on the side of the map so they had to be filled in with the help of other groups' maps.

Next, the groups had to mark the five locations. This was done by looking at the coordinates given, as shown in figure 2. The points were a bit off on the map from their true location so the GPS unit helped to find the true locations in the field.

The final step was to go out into the field and navigate to the points by using the given coordinate systems, paper map, and GPS unit (Figure 4).
Figure 4: The track log from the GPS unit while navigating the Priory

Discussion:

I noticed it was difficult at times to navigate using the GPS. The group had backtracked a few times because it was hard to get bearings at times. It was difficult to navigate both the northing and easting while walking. The terrain varied greatly, from one area containing thick underbrush, to another area having easily accessible deer paths or a large mowed path, and one area was an open pine tree farm.

Activity 10: Processing UAS Data in Pix4D

Introduction:

This activity is in preparation for an Unmanned Aerial Systems (UAS) lab at the end of the semester. Dr. Hupy gave the class two separate folders (baseball field and track field) containing UAS images within the city of Eau Claire, Wisconsin taken by a previous class. These images would be used in Pix4D to create a georeferenced mosaic of imagery.

Description:


  • What is the overlap needed for Pix4D to process imagery? 
  • What if the user is flying over sand/snow, or uniform fields?
Pix4D is a program that processes images to create a Digital Elevation Model (DEM) as well as a high resolution 3D image of the terrain. It is based on automatically finding thousands of common points between images, and the more common points there are the more accurately the 3D points can be computed. So the main rule to have is to maintain a high overlap between the images. That means at least 75% frontal and 60% side overlap in general cases. There are special precautions to take when taking images of different features. Snow and sand for example have little visual content due to large uniform areas. So it is important to use a high overlap of at leat 85% frontal overlap and at least 70% side overlap. It is also important to set the exposure settings accordingly, to get as much contrast as possible in each image.

  • What is Rapid Check?
There are a couple of templates that can be used. A full processing technique basically provides the best resolution possible, but this takes a significant amount of time so this method is best used when in the office. There is also a rapid check that reduces the resolution of the original images which results in lowered accuracy. This is significantly faster than the full processing, so it is recommended to use while still in the field.

  • Can Pix4D process multiple flights? What does the pilot need to maintain if so?
Yes, it is possible to process each flight separately and then merge the several subprojects. The pilot needs to keep the same horizontal and vertical coordinate system for each flight. The GCPs also have to be in the same horizontal and vertical coordinate systems. And the horizontal and vertical coordinate systems for the output must be the same. It is also important to fly at the same altitude for each flight to keep the resolutions as similar as possible.

  • Can Pix4D process oblique images? What type of data do you need if so?
Yes, Pix4D can process oblique images. The user would need to know at what angle off nadir the images were collected.

  • Are GCPs necessary for Pix4D? When are they highly recommended?
They are not necessary, but they are highly recommended when processing a project with no image geolocation. GCPs give scale, orientation, and absolute position information. 

  • What is the quality report?
It provides all of the metadata behind the processing, such as the amount of overlap between images, the camera used, the coordinate systems,  the image positions, etc. 

Methods:

Figure 2: Selecting  the type of output image
Figure 1: Adding images to Pix4D
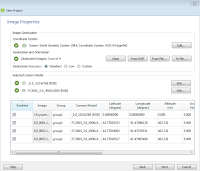
Pix4DMapper Pro was opened to a new project where a setup window appeared. Every image in the file folder of the track field were added (Figure 1). The project was saved to a working folder. From there, a 3D model map view was chosen (Figure 2). 


Figure 3: The initial window of the data in mapview
After the parameters were set in the setup menu, a view of the locations where the images were tied down to the earth appeared (Figure 3). From here, the processing tab on the bottom left was clicked where a processing window (Figure 4) appeared. This mosaics the images based on points, vertices, and geotags associated with each image. There are three processes that take place to provide a desired output. The first is an initial processing which is a preliminary step to see if the images are able to provide an accurate output mosaiced image. The next is a point cloud which is a 3D look at an object in an image. The final step is the DSM and Orthomosaic. Each of these outputs was saved to the designated working folder and once the initial processing was finished, a quality report was created to help see how well the images overlap as well as a variety of other important information (See Figures Below).
Figure 4: Processing Window


Quality report images